To check if everything is working as expected, like you are a developer and you have few features in your application, where to complete a single transaction it needs to pass through a programming logic of different methods, classes, etc. When something goes wrong it’s very difficult to identify which feature/ piece of code caused this.
To identify the error location in the code and verify the execution flow where the logic got failed whether it’s because of developer mistake or by Platform on which code is running it’s always a good idea to setup debug logs to pinpoint the issue.
What is Salesforce Debug Log?
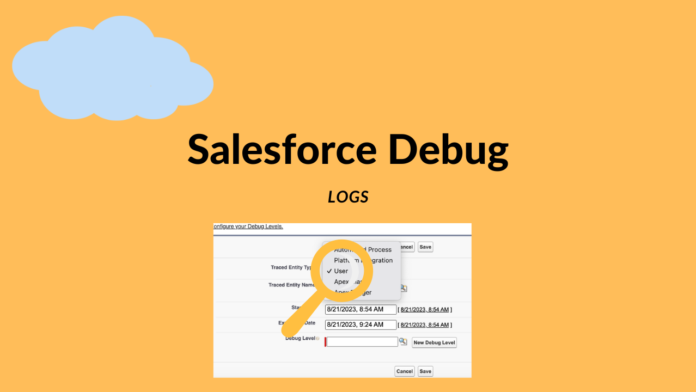
Here in Salesforce we can set up debug logs to identify and track the issue in Apex logic and many declarative tools like Flow, Process, Approval Process. For live troubleshooting we use Debug logs.
Utilize debug logs to monitor events within your Salesforce organization. Debug logs are produced under conditions of active user-based trace flags, during the execution of Apex tests, and when executed code or API requests contain debugging parameters or headers.
A debug log has the capacity to document database operations, system processes, and errors that transpire during the execution of a transaction or the implementation of unit tests
Debug logs possess the potential to encompass information regarding:
- Apex errors
- Resources used by Apex
- Approval processes
- Validation rules
- Workflow rules
- Assignment rules
- Database changes
- HTTP callouts
- Apex errors
- Resources used by Apex
System generates logs when it meets the required/ set criteria – Below are the few action those might create a transactions
- Executeanonymous
- Web Service
- Email Service
- User Interaction
Please refer below scenario where you can use debug logs:
In the role of a developer crafting a custom application, the debug log becomes a valuable tool to affirm the application’s behavior. One illustrative use is configuring the debug log filter to specifically scrutinize callouts. Within the ensuing debug log, it becomes possible to examine comprehensive details regarding the outcome and timeframe of these callouts, enhancing insights into their success and performance
It’s essential to keep these debug log limits in mind when monitoring and troubleshooting applications in your Salesforce org.
Log Size Limit:
The size of each debug log is capped at a maximum of 20 MB. If a debug log surpasses this size threshold, it undergoes reduction by eliminating older log lines, which may encompass earlier System.debug statements. This trimming is done to ensure conformity with the specified size limit.
Log Line Retention:
Log lines have the flexibility to be removed from any point within the debug log, not solely limited to the initial entries.
Retention Period:
System debug logs persist for a duration of 24 hours, while monitoring debug logs, in contrast, are preserved for a span of seven days.
Trace Flags Disabling:
Should you produce an excess of 1,000 MB in debug logs during a 15-minute interval, your trace flags will undergo automatic deactivation. Users who most recently modified the trace flags will receive an email notification, apprising them of the opportunity to reinstate the trace flags following a 15-minute cooling period.
Log Truncation:
For optimal relevance, debug logs are truncated, typically commencing with earlier log entries. The latest log entries remain unaffected. Upon reaching the 20 MB size limit, 200 KB of the debug log content is removed.
The subsequent events are essential for processing the debug log, ensuring their retention even during truncation.
- FATAL_ERROR
- SOQL_EXECUTE_BEGIN
- SOQL_EXECUTE_END
- SOSL_EXECUTE_BEGIN
- SOSL_EXECUTE_END
- EXECUTION_STARTED
- METHOD_EXIT
- CONSTRUCTOR_ENTRY
- CONSTRUCTOR_EXIT
- CALLOUT_REQUEST
- CALLOUT_RESPONSE
- EXECUTION_FINISHED
- CODE_UNIT_STARTED
- CODE_UNIT_FINISHED
- METHOD_ENTRY


